See Methodology Notes
The simulation model uses custom data tabulation from Statistics Canada’s Postsecondary Student Information System (PSIS) and the Education and Labour Market Longitudinal Platform (ELMLP). These data are produced in collaboration with the Canadian Centre for Education Statistics to track MRT cohorts from enrolment to employment. Enrolment and graduate count data for Radiological Technology training in Newfoundland and Labrador are obtained directly from the College of the North Atlantic, while the graduation rate for Radiological Technology in Saskatchewan are derived by incorporating program-level data obtained directly from Saskatchewan Polytechnic.
Custom data tabulation from Statistics Canada are rounded to ensure data confidentiality in accordance with its disclosure control requirements. Entry cohort counts are randomly rounded to the nearest three (3), while all other values are rounded to the nearest ten (10). Small cell counts that could potentially lead to the identification of individuals are suppressed by Statistics Canada prior to the calculation of default rates by Health Workforce Canada. As such, all data presented in the simulation are estimates and should not be interpreted as exact values.
- Enrollment Data
Default enrolment values represent the average annual enrolment of cohorts entering education programs in 2020/21, 2021/22, and 2022/23. The most recent entry cohort enrolment data are from 2022/23, and values reported by the model, from 2023 to 2025, replicate the average enrolment counts. The data are thus static after 2022/23 unless users enter revised counts, which apply from 2026 onwards.
In some instances, incomplete or unlikely counts of the number of students in each annual entry cohort (enrolment) are estimated. This is done by dividing the annual graduate count by the graduation rate in each training province and for each MRT specialization. Since training programs within a province for a particular MRT specialization can have different expected program completion lengths (e.g., 3 and 4 years for radiation therapy programs in Ontario), two approaches are used to assign revised entry cohort values to the appropriate a program start year.
Approach 1 — Unique program duration for an MRT specialization in a training province
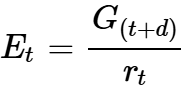
When all training programs for an MRT specialization in a province have the same expected completion length (d), e.g., 3 years, the entry cohort size for year t is inferred using the graduate count (G) observed in year (t+d) and the graduation rate (rₜ) for that cohort:
Definitions:
 – Entry cohort size (enrolment) in year t
  – Graduation rate for cohort t (decimal form)
  – Number of graduates observed in calendar year t+d
 – Program duration (years)
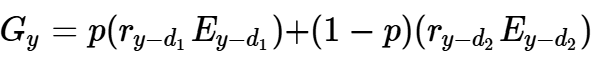
Approach 2 — Multiple program durations (e.g., 3 and 4 years) for an MRT specialization in a training province
When different training programs for an MRT specialization in a province have different expected completion lengths (d), e.g., 3 and 4 years, we apply a proportional approach to estimate the entry cohort size across program initiation years. For instance, when there are programs with two completion lengths (d), proportions p and 1−p are assigned to durations d₁ and d₂ respectively. Therefore, graduates G in year y are a mixture of two cohorts:
To estimate entry cohort size in year t (Eₜ), we use the graduates observed in year t + d₁. Solving the flow equation for Eₜ yields:
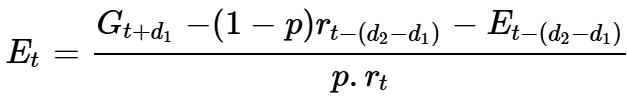
A more detailed explanation, including examples, will be available in the model’s user guide.
- Graduation Data and Rates
Default graduation rates represent the average graduation percentage of cohorts who entered training in 2015/16, 2016/17, and 2017/18. Graduation percentage is based on a five-year follow-up of entry cohorts to ascertain if students had graduated by the end of the fifth year. In the simulation model, when provincial-level data is unavailable (i.e., due to suppression), averages based on all contributing jurisdictions, for each MRT specialization, are used.
For jurisdictions without an MRT program—or without a program in the selected specialty—a default entry cohort of zero (i.e., Entry Cohort (n=0)) is shown. In these cases, the model applies the pan‑Canadian average graduation rate described above for that specialty, which users may also adjust when simulating a new program.
Table A: Default Pan-Canadian Average Graduation Rates by MRT Specialization
Specialization Pan-Canadian Average Graduation Rate (%) Jurisdictions where the Pan‑Canadian rate was applied Radiological Technology 75.7 Newfoundland and Labrador, Prince Edward Island, New Brunswick, and the territories Nuclear Medicine 75.1 All provinces and territories Radiation Therapy 55.6 All provinces and territories, except Quebec MRI 55.6 All provinces and territories In the simulation, enrollee progression is modelled deterministically based on program duration. For example, individuals entering a two-year program in 2025-26 are assumed to graduate and enter the workforce in 2027.
- Employment Status and Other Outcomes After Graduation
Post-graduation outcomes were classified into three possible categories: employed in Canada, pursuing further full-time studies, or presumed to have left Canada after graduation. These outcomes were derived through a linked dataset (ELMLP) combining educational records (PSIS) and CRA tax filings. Outcomes for MRT graduates are assessed two years after graduation. For example, evidence of employment for the 2022 graduate cohort is based on tax filings for the 2024 tax year. Employment status is inferred from CRA-reported income, but these data cannot confirm whether graduates are employed as MRTs or in their area of specialization; we are continuing to explore additional data sources to enable that distinction. Those with no CRA reported income are assumed to have left Canada.
The rates for each of the three possible post-graduation outcomes were based on the midpoint of two pooled graduate cohorts, each containing three years of data. The first cohort included MRTs graduating in 2016, 2017 and 2018. The second cohort included those graduating in 2019, 2020 and 2021. These annual cohort data points are pooled to be released by Statistics Canada. In the simulation model, only one of the three post-graduation outcomes can be modified: the rate of employment among those who graduated from an MRT program.
For provinces without available postgraduation outcome proportions—due to small cohort sizes or the absence of a program (i.e., identifiable Entry Cohort (n=0) in the parameter selection table)—the default pan Canadian employment rates are applied for each specialization (see Table B).
Table B: Default Pan-Canadian Average Employment Rates, by MRT Specialization
Specialization Pan-Canadian Employment Rate (%) Jurisdiction where the Pan-Canadian Average Rate was Applied Radiological Technology 93.0 Territories Nuclear Medicine 91.2 Prince Edward Island, New Brunswick, Ontario, Manitoba, Saskatchewan, Newfoundland and Labrador, Territories Radiation Therapy 89.0 Prince Edward Island, Nova Scotia, New Brunswick, Saskatchewan, Newfoundland and Labrador, Territories MRI 92.0 Prince Edward Island, Nova Scotia, New Brunswick, Quebec, Saskatchewan, Newfoundland and Labrador, Territories There are no MRT training programs in any of the territories.
- Employment in the Province of Training (Retention) and Interprovincial Migration After Graduation
Retention in the province of training is a modifiable model parameter for MRT graduates who enter the Canadian workforce after completing their program. Historical migration trends are calculated using pooled annual cohorts from the ELMLP by comparing the province of graduation with the province/territory of residence two years after graduation, as reported through CRA tax filings.
The model’s two migration outcomes: 1) whether graduates are employed in their province of training or in another Canadian jurisdiction, and; 2) the distribution of employed MRTs across jurisdictions (e.g., 85% in the training province, 10% in province A, 5% in province B), cannot be disaggregated by MRT specialty. In other words, while migration patterns can be disaggregated and displayed by province of training, the underlying data does not allow MRT specialty to be disaggregated for migration trends.
For modelling scenarios where MRTs hypothetically trained and graduated from programs in the territories (i.e., when users enter a positive value in the Entry Cohort (n) column), employment retention in the territories is set at 100%. At the time of developing this model, there were no MRT training programs available in the territories, and as a result, no post-graduation mobility data.
Program-Specific Graduation Timing Adjustments
To reflect differences in program length within provinces and specializations, years to graduation were adjusted as follows:
Radiological Technology (2- and 4-year programs available) – New Brunswick: 50% of graduates assigned completion status 2 years after entry, and 50 of graduates assigned completion status 4 years after entry.
Example: For an entry cohort of 100 students in the 2025/26 academic year with an 80% graduation rate, 40% students will graduate in 2027 and 40 will graduate in 2029.
- Radiation Therapy – Ontario (3- and 4-year programs available): 50% of graduates assigned completion status 3 years after entry, and 50% of graduates assigned completion status 4 years after entry.
- Radiological Technology – Ontario (3- and 4-year programs available): 85% of graduates assigned completion status 3 years after entry, and 15% of graduates assigned completion status 4 years after entry.
Table C: MRT Program Length(s) Assigned to Province/Territories without Specialized Programs
Specialization Program Length(s) in Years Jurisdiction where the Pan-Canadian average program length was applied Nuclear Medicine 3 Prince Edward Island, New Brunswick, Ontario, Manitoba, Saskatchewan, Newfoundland and Labrador, Territories Radiation Therapy 3 (50% of graduates) and 4 (50% of graduates)
Prince Edward Island, Nova Scotia, New Brunswick, Saskatchewan, Newfoundland and Labrador Magnetic Resonance Imaging 2 Prince Edward Island, Nova Scotia, New Brunswick, Saskatchewan, Newfoundland and Labrador, Territories In the territories, a 3‑year program length for hypothetical radiation technology programs is assumed. This assumption is based on the following rationale: the territories have only one university (Yukon University), which does not offer any 4‑year health‑related degrees. If an MRT program were to be established in the territories, it would most likely be delivered through a college. College‑level radiation technology programs in Canada typically have a maximum duration of 3 years, with most radiation technology programs across the country following this 3–year format.
- Post-Graduation Routing and Assignment of Employment Location
Post-graduation outcomes in the simulation are assigned using a hybrid deterministic–stochastic approach. The model’s algorithm adjusts whether outcomes are derived deterministically or stochastically based on cohort size. For entry cohorts with enrolment sizes ≤20, post-graduation outcomes are allocated deterministically into expected values based on observed rates (or historical distribution across outcomes). For cohorts with enrolment counts > 20, outcomes are assigned stochastically at the cohort/jurisdiction/specialization level.
For larger cohorts (>20, stochastic approach), each graduate is randomly assigned to one of the three postgraduation outcomes—employed, pursuing further fulltime studies, or leaving Canada—using a simple random draw. The model generates a value between 0 and 1 for each graduate and assigns an outcome based on the observed distribution of these pathways.
For example, Ontario’s 2024 radiological technology graduates have the following average postgraduation distribution: 80% employed, 15% in further fulltime studies, and 5% leaving Canada. These correspond to the following cumulative probability ranges:
- Employed: 0.000 to 0.800
- Further fulltime studies: 0.800 to 0.950
- Leaving Canada: 0.950 to 1.000
A simulated value of 0.878 thus falls within the 0.800–0.950 interval and the graduate would be assigned a post-graduation status of being in further fulltime studies. Similarly, randomly generated value of 0.970 falls within the 0.950–1.000 range and the graduate is assigned a status of having left Canada.
The same stochastic approach is applied to assign employed MRT graduates to a province or territory of employment. For example, if newly graduated Radiological Technology employees from Ontario have an observed employment distribution of 80% in Ontario, 15% in Alberta, and 5% in Manitoba, the model generates a random probability between 0 and 1 for each employed graduate and assigns their employment location using cumulative probability ranges:
- Ontario: 0.000 to 0.800
- Alberta: 0.800 to 0.950
- Manitoba: 0.950 to 1.000
A simulated value of 0.878 falls within the 0.800–0.950 interval, so the graduate is assigned to employment in Alberta. A value of 0.970 falls within the 0.950–1.000 range and the graduate is therefore assigned to employment in Manitoba. Because outcomes for larger cohorts are assigned stochastically, simulation results represent probabilistic realizations rather than exact predictions and rerunning the model more than once would generate alternative estimates. That would not be the case for deterministically determined post-graduation outcomes for small cohorts, which as a result will have numerical stability and limited volatility.